- blog -

In-depth model analytics in Metamaze

Are you tired of feeling like your models are a mysterious black box with no insight into how they work and evolve? Do you want to take control of the performance and improve your models with ease? We’re thrilled to spotlight the in-depth Model Analytics feature that takes this to the next level.

When implementing an Intelligent Document Processing solution, there is no doubt you want to know if the underlying machine learning models are working properly and can be used with trust. Furthermore, you want to see if the performance is improving over time and how you can do this. But not many solutions offer good and understandable insights on this topic. At Metamaze, we focused heavily on creating analytics features that give you all the insights you need. In this article, we give you an overview of how our In-Depth Model Analytics feature works.

Introducing the in-depth model analytics feature

Are you tired of feeling like your models are a mysterious black box with no insight into how they work and evolve? Do you want to take control of the performance and improve your models with ease?

We’re thrilled to spotlight the in-depth Model Analytics feature that takes this to the next level. This exciting new feature provides in-depth analysis and visualizations that give you a clear understanding of how your models are performing, how they’re evolving, and how you can make improvements. Say goodbye to the frustration of not being able to fully understand your models and hello to Model Analytics, the tool you need to optimize your models and drive better automation results.

Understand & Optimize Your Models for Better Results with Model Analytics Insights

To make the most out of the Model Analytics feature, it’s crucial to understand how to use the different graphs and tables to get insights on how to optimize your models for better results.

General metrics

For each part of the Model Analytics, general performance metrics are displayed through graphs that illustrate their evolution over time, including metrics such as the number of documents, F1 Score, Precision, and Recall. For entity extraction, the performance of each entity type is shown in separate lines and a Straight-Through-Processing (STP) rate is calculated. The displayed metrics are based on the validation set (10% of the training data).

Document classification & page management metrics evolution over time
Entity extraction metrics evolution over time

Confusion Matrix

The confusion matrix is a tool to evaluate the performance of a model in both document classification and page management. It provides a clear representation of the number of true positive, false positive, true negative, and false negative predictions made by the model. This information can help understand where the model might be making mistakes and what areas need improvement.

In document classification for instance, when you notice that 2 document types are mixed up a lot, you should either consider merging them into one document type or check whether the document types have been annotated correctly in the training data.

For page management, the confusion matrix can be used to evaluate the performance of the model in terms of how accurately it classifies pages.

Confusion Matrix Intelligent Document Processing
Confusion matrix to inspect mispredictions of the model on the validation dataset
Confusion matrix IDP
A more detailed confusion matrix for a specific document type

Precision-Recall Graph

The Precision-Recall graph is a powerful visual representation of the trade-off between Precision and Recall for each document type or page type. It can be used to choose the optimal prediction threshold in the production flow. The graph plots the Precision against the Recall and provides insights into the trade-off between the two metrics. For the example below, if the threshold is set to 90, Precision will be 91% and Recall 69%.

Depending on the use case, you can set the threshold so you have a higher Precision (in case it is very important to have no false positives, and less important if there are false negatives) or a higher Recall (in case it is very important to find all examples of a certain type, even if this means that there will be more false positives).

Precision recall graph
A Precision-Recall graph to find the best confidence score threshold for your use case

Entity extraction performance metrics

For entity extraction, a table provides an organized and easy-to-read overview of entity metrics, making it easy to identify any entities that your model may be struggling to extract correctly. For each entity you can see the number of documents on which the entity is present, the number of annotations for the entity, the F1 Score, the Precision, the Recall and the False Discovery Rate. This information can help to understand why an entity may not be recognized well, whether due to low frequency in the training data or annotation quality issues.

For example, if a frequently occurring entity is not well recognized, it may indicate issues with the annotation quality. The document and annotation counts are based on the training set, while the accuracy metrics are calculated based on the validation set.

Intelligent document processing entity level metrics
Table showing entity level metrics

Final Thoughts on Using Model Analytics to Improve Your Models

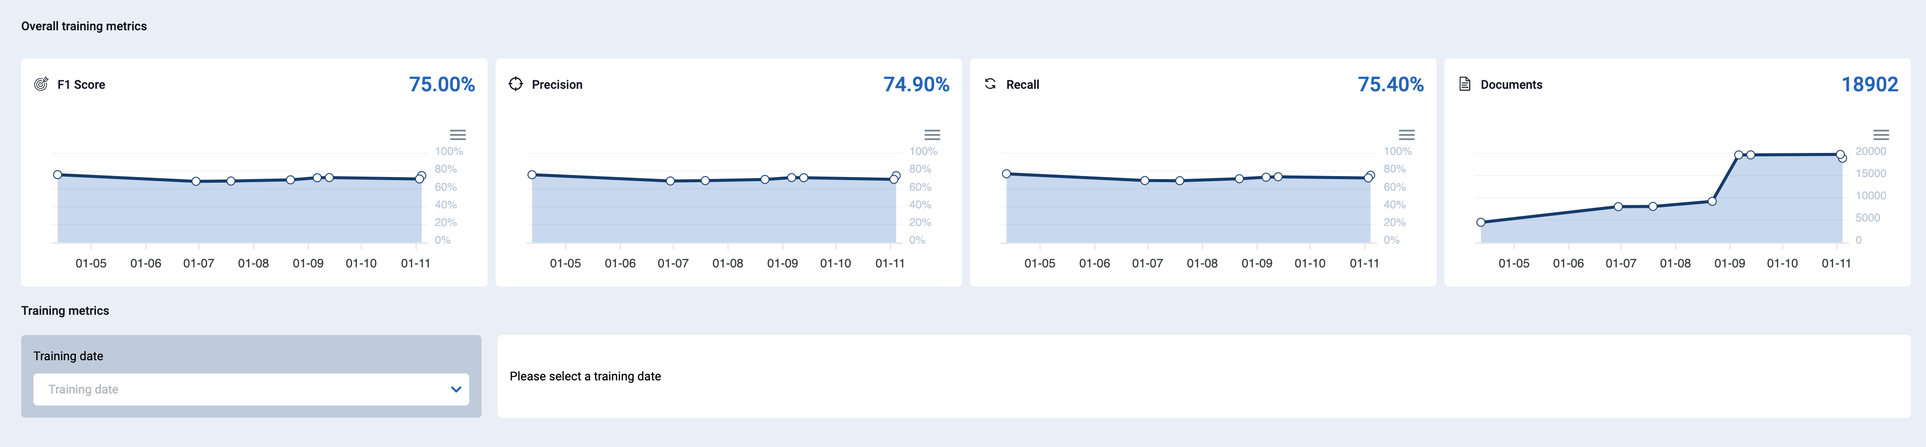
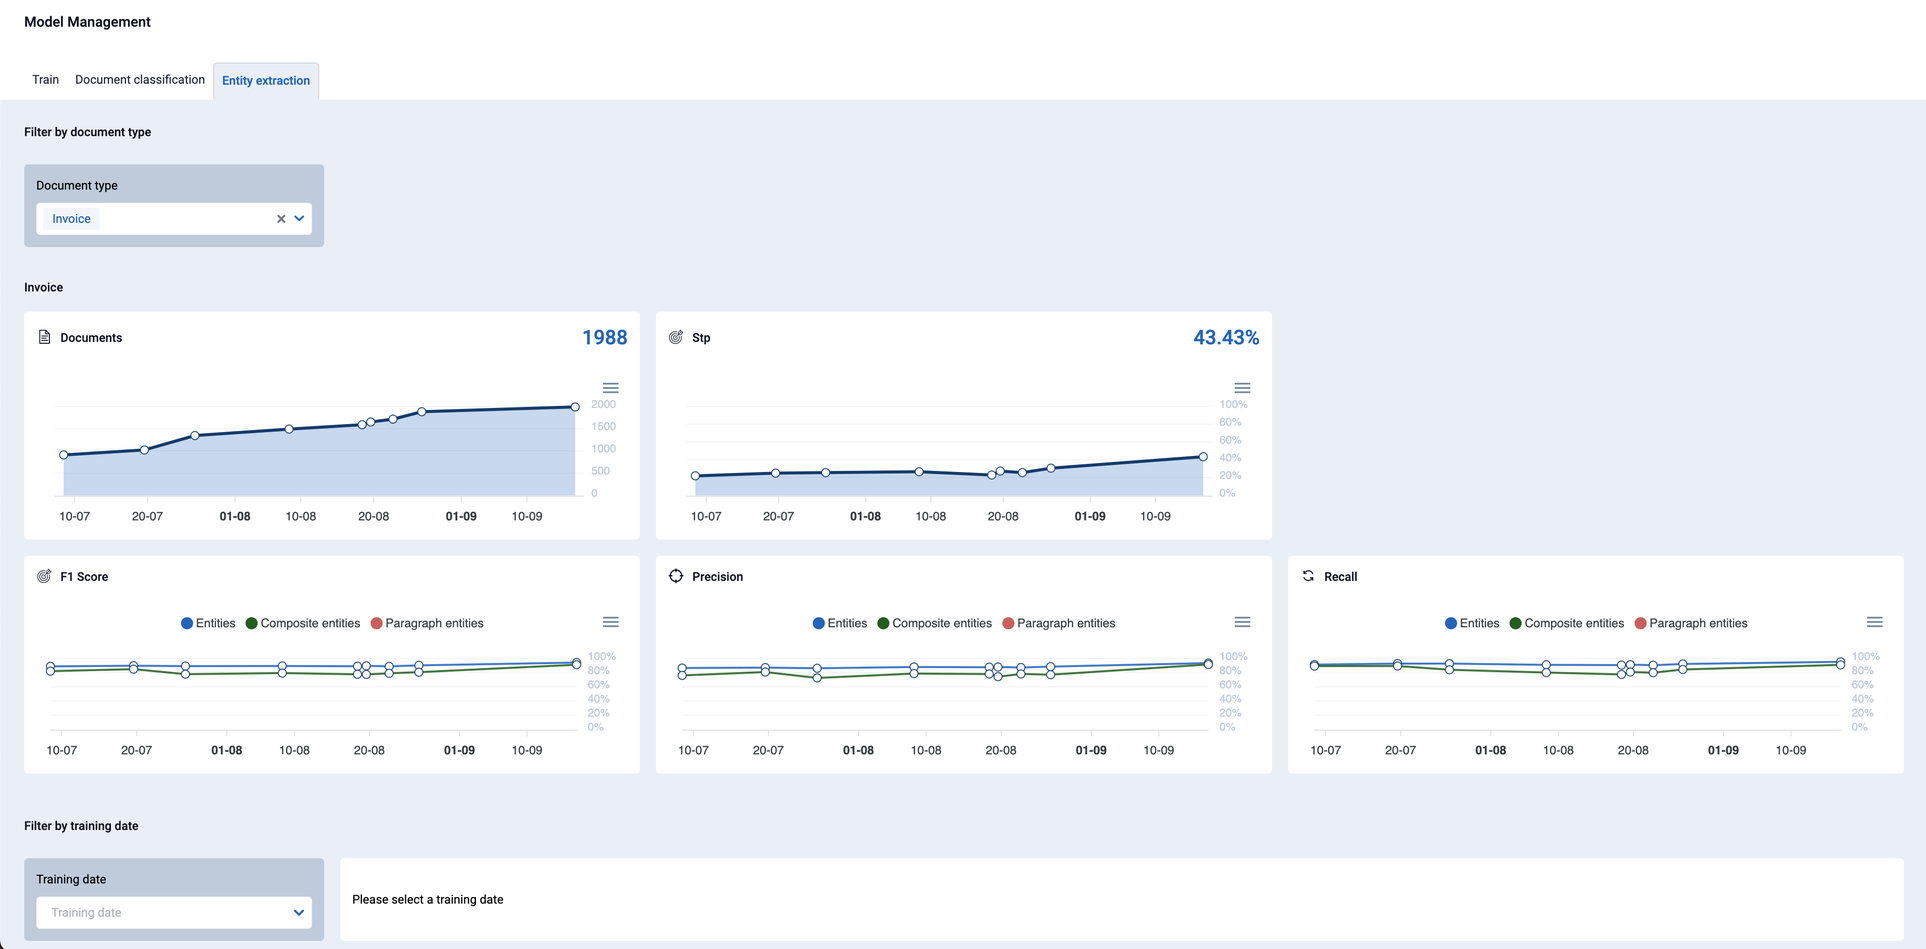
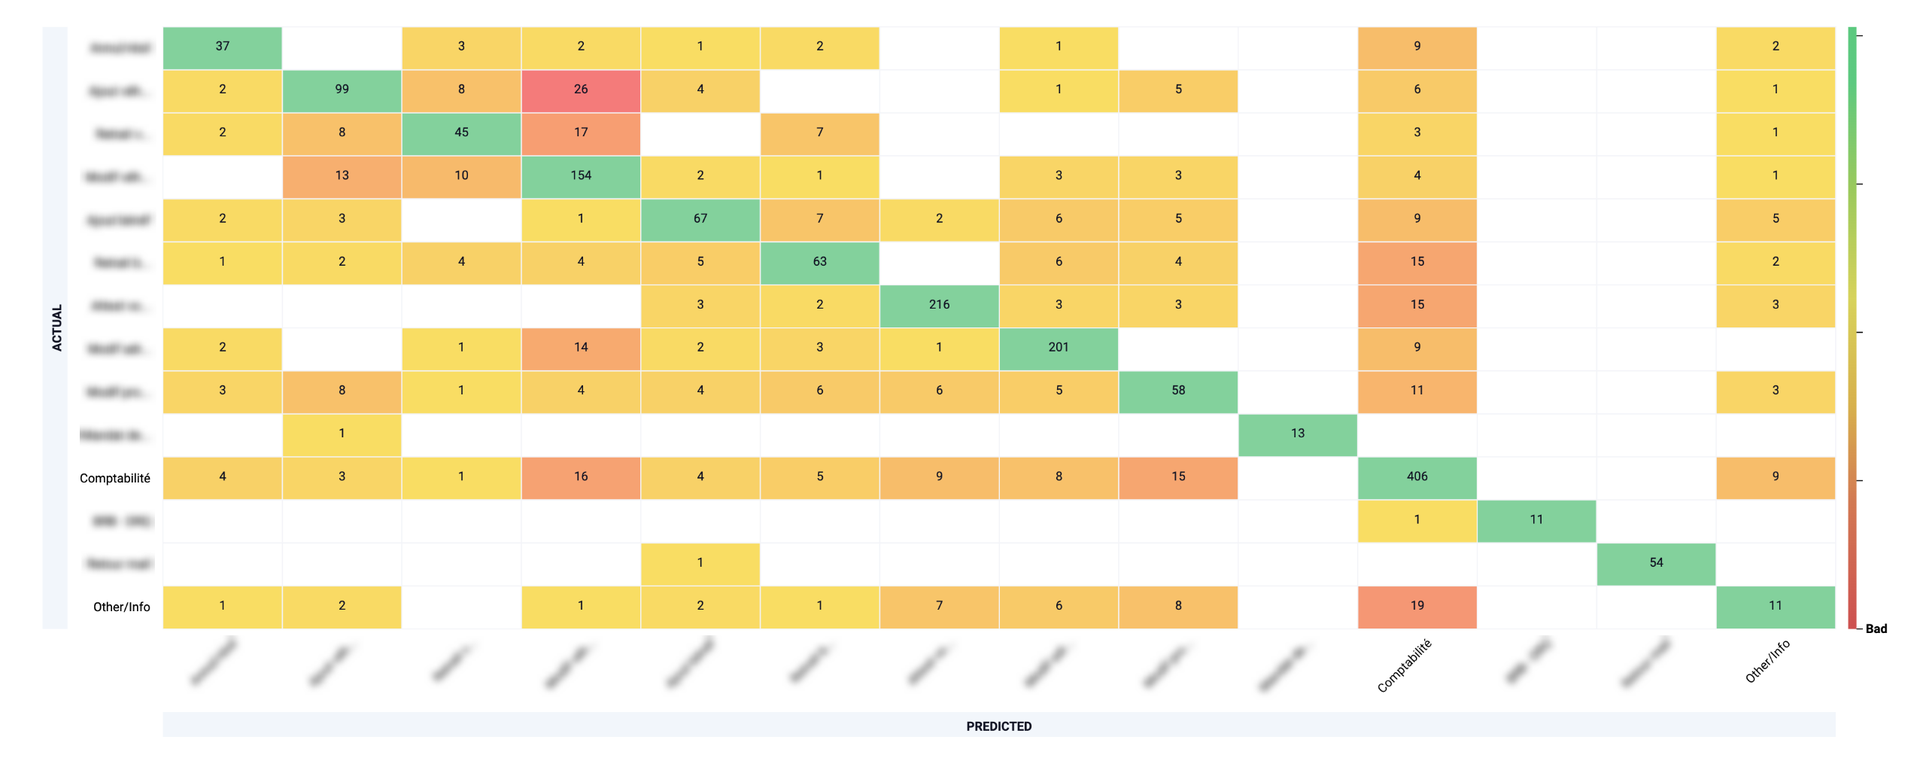
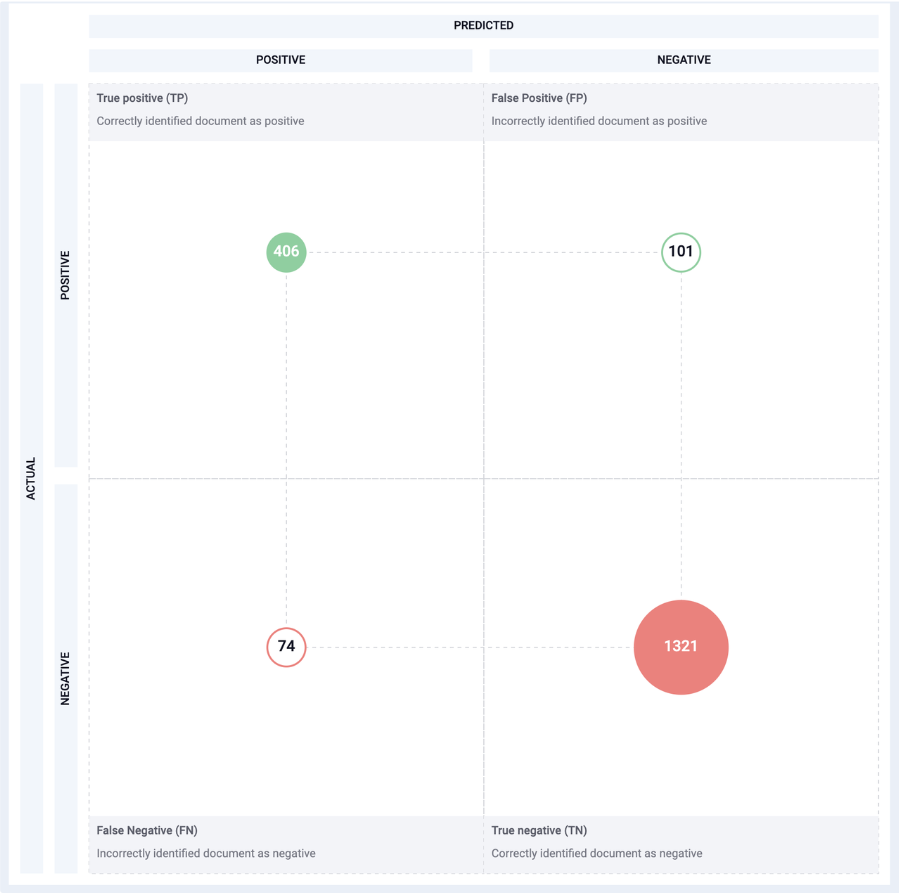
AI is not magic nor a black box, its performance is also not static. It’s all about the data you feed to the model and how you are in control of the performance of your model. Thanks to our in-depth insights, you can quickly identify areas where your models may need improvement, make data-driven decisions to enhance their performance, and ultimately save time and resources to achieve better automation results. Whether you’re a seasoned machine learning professional or just starting out, the Model Analytics feature in Metamaze makes it easy to measure and improve your models.

Table of Contents

See model analytics in action

Get a live demonstration of our in-depth model analytics feature and the full platform. Schedule your demo today.

Shopping Basket

Subscribe to our newsletter

Let's join forces