We have improved the way confidence scores (percentage scores you see in the UI for entities) are calibrated. Basically we made the scores more accurate.
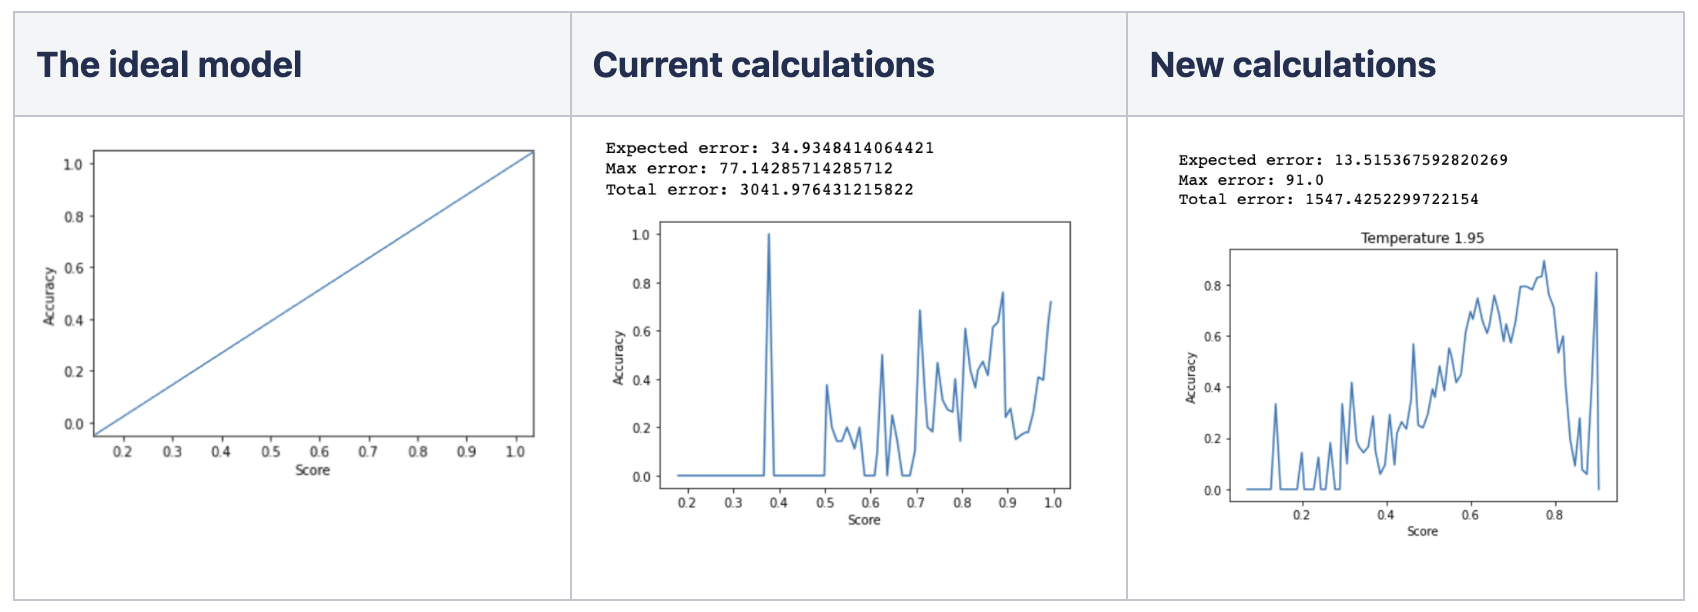
What you see in the above images is that the left image shows the perfect model with the perfect data where the calculated scores perfectly match the accuracy (incase you were wondering, this does not exist in real life). The middle image shows our current solution to calculate the score. As you can see most of the scores ended up in the regions between 50% – 100%. The new calculations which are shown in the right image, show that the calculated scores are more in line with the accuracy.
What this means, for you as an admin, is that the accuracy scores in general will be lower than before. However this does not mean the model is doing worse. We tried to add a stronger correlation between scores and accuracy: lower scores are more likely to correspond to bad predictions.
As you are an admin in the Metamaze application, we recommend you to review the thresholds after your next training. It might be needed to lower them to obtain the same automation rate as before.
Training improvement
We have changed the way how models are trained. This new approach will further increase the training speed (see release 2.2 for more info on our previous improvements on this), how much it improves depends on the complexity and size of the datasets. An extra benefit with the new approach is that for smaller datasets the accuracy improves too!
Another improvement to increase the training speed is in the way we retried trainings in the past. When a training would get interrupted (network issues for example), the training would start from scratch for a training step. We now take advantage of the checkpointswhich are created. When a training gets interrupted and needs to be retried, it will now start from the last known checkpoint instead of the start of a training step.
Our full product team is very enthusiastic about these improvements. If you have any problems, questions or need advise with the thresholds settings, don’t hesitate to reach out to us via support@metamaze.eu.
CONTACT US
Questions or problems?
Don’t hesitate to reach out to support@metamaze.eu